Home
Categories
EXPLORE
True Crime
Comedy
Society & Culture
Business
Sports
Technology
Health & Fitness
About Us
Contact Us
Copyright
© 2024 PodJoint
Podjoint Logo
US
00:00 / 00:00
Sign in

or

Don't have an account?
Sign up
Forgot password
https://is1-ssl.mzstatic.com/image/thumb/Podcasts211/v4/97/47/64/974764a2-10de-36bf-a142-1df761e3746b/mza_6961311833896743958.jpg/600x600bb.jpg
The Data Literacy Show
Data Literacy
11 episodes
2 days ago
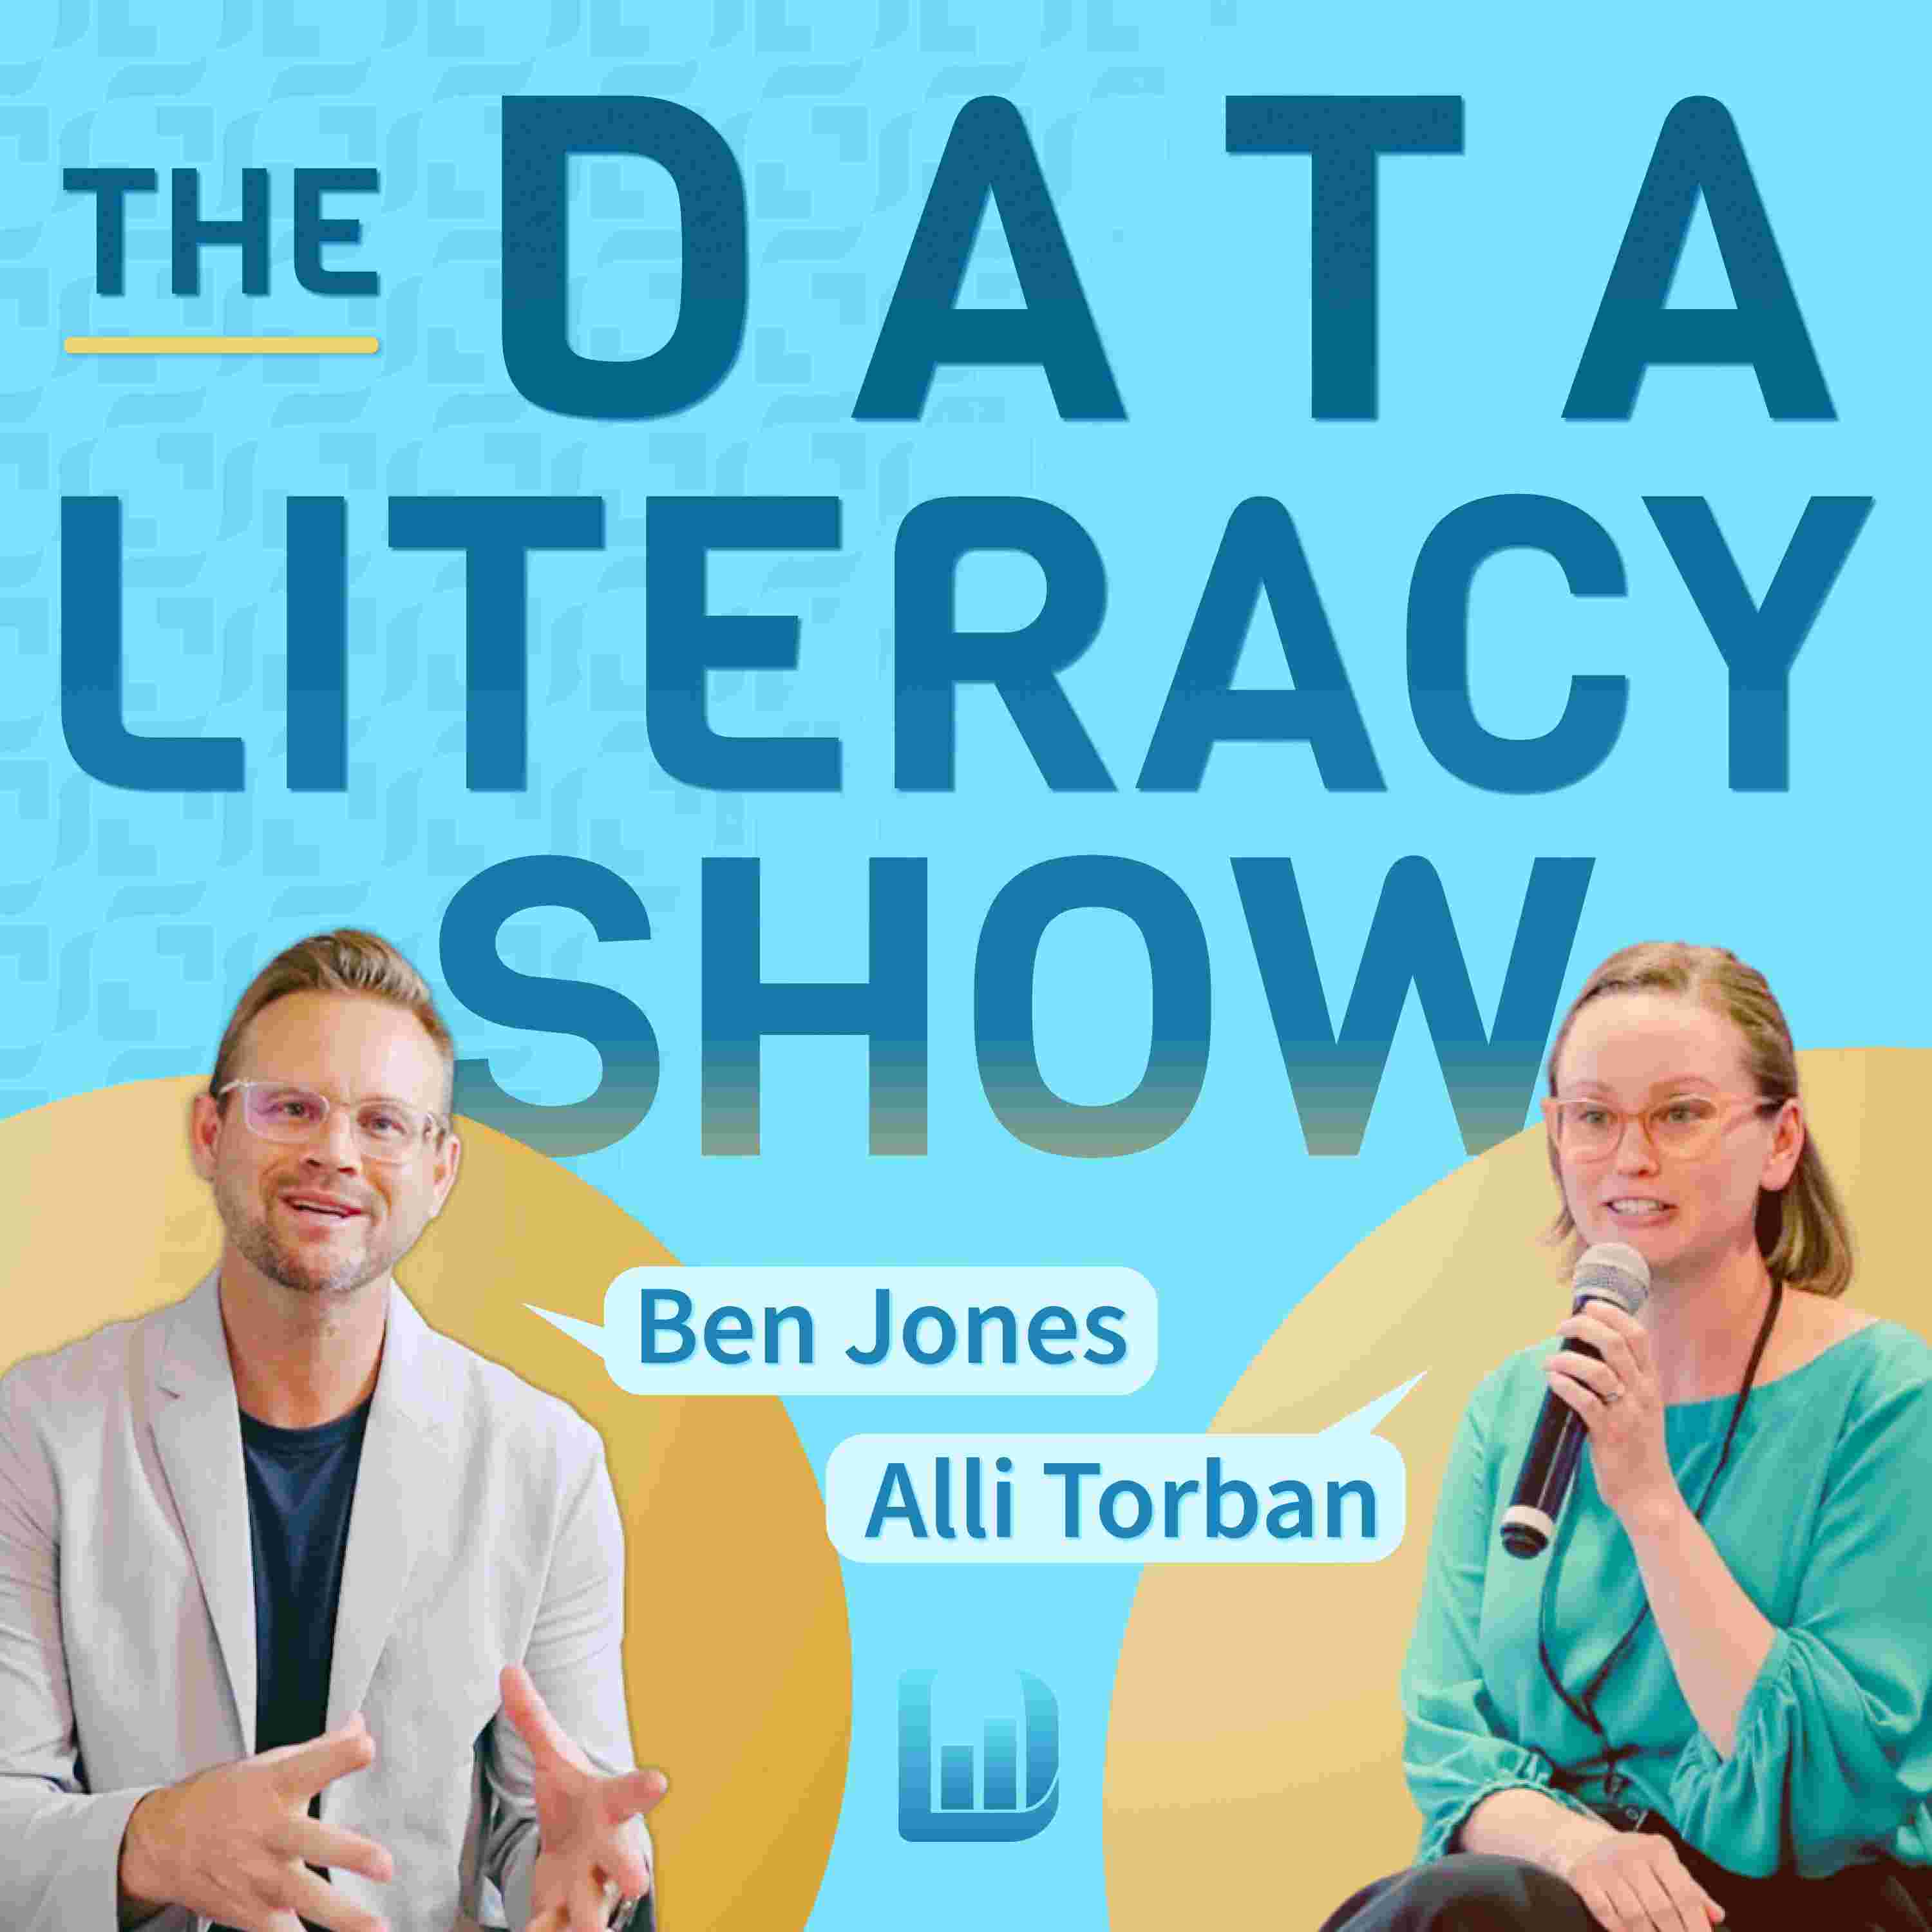
The Data Literacy Show helps organizations build, measure, and level up their data and AI literacy. Hosted by Ben Jones, CEO of Data Literacy, and Alli Torban, Senior Data Literacy Advocate, this monthly podcast delivers practical strategies & real-world insights for developing data-driven teams. Perfect for executives, managers, and learning & development teams, The Data Literacy Show combines strategic insights with tactical implementation. From conducting skills assessments to building buy-in for data initiatives, we cover the critical elements that make data literacy programs successful.
Show more...
Technology
RSS
All content for The Data Literacy Show is the property of Data Literacy and is served directly from their servers with no modification, redirects, or rehosting. The podcast is not affiliated with or endorsed by Podjoint in any way.
The Data Literacy Show helps organizations build, measure, and level up their data and AI literacy. Hosted by Ben Jones, CEO of Data Literacy, and Alli Torban, Senior Data Literacy Advocate, this monthly podcast delivers practical strategies & real-world insights for developing data-driven teams. Perfect for executives, managers, and learning & development teams, The Data Literacy Show combines strategic insights with tactical implementation. From conducting skills assessments to building buy-in for data initiatives, we cover the critical elements that make data literacy programs successful.
Show more...
Technology
https://d3t3ozftmdmh3i.cloudfront.net/staging/podcast_uploaded_nologo/42893156/42893156-1737558342819-182ffbf921ae6.jpg
08: 3 Chart Swaps to Make Your Graphics More Effective
The Data Literacy Show
18 minutes 38 seconds
2 months ago
08: 3 Chart Swaps to Make Your Graphics More Effective

In this episode of The Data Literacy Show, hosts Ben Jones (CEO of Data Literacy) and Alli Torban (Senior Data Literacy Advocate) share 3 smart chart swaps that instantly improve the clarity and impact of your data graphics. Whether you're presenting to executives or designing reports, these quick swaps help your audience grasp what matters.

Topics covered:

  • Why using two pie charts to show change over time is hard to read, and what to try instead

  • How small multiples can solve the problems of cluttered stacked bar charts

  • When to swap a bullet chart for a diverging bar chart to better show performance vs. target


Links mentioned:
⁠Level 1: Learning to See Data on-demand course: learn the building blocks of charts, common types, when to use them, and more.

Episode show notes: ⁠⁠⁠⁠⁠http://dataliteracy.com/episode-08

The Data Literacy Show
The Data Literacy Show helps organizations build, measure, and level up their data and AI literacy. Hosted by Ben Jones, CEO of Data Literacy, and Alli Torban, Senior Data Literacy Advocate, this monthly podcast delivers practical strategies & real-world insights for developing data-driven teams. Perfect for executives, managers, and learning & development teams, The Data Literacy Show combines strategic insights with tactical implementation. From conducting skills assessments to building buy-in for data initiatives, we cover the critical elements that make data literacy programs successful.